
Mapsv1.0.2
Calendar Heatmap
M
Published by metabase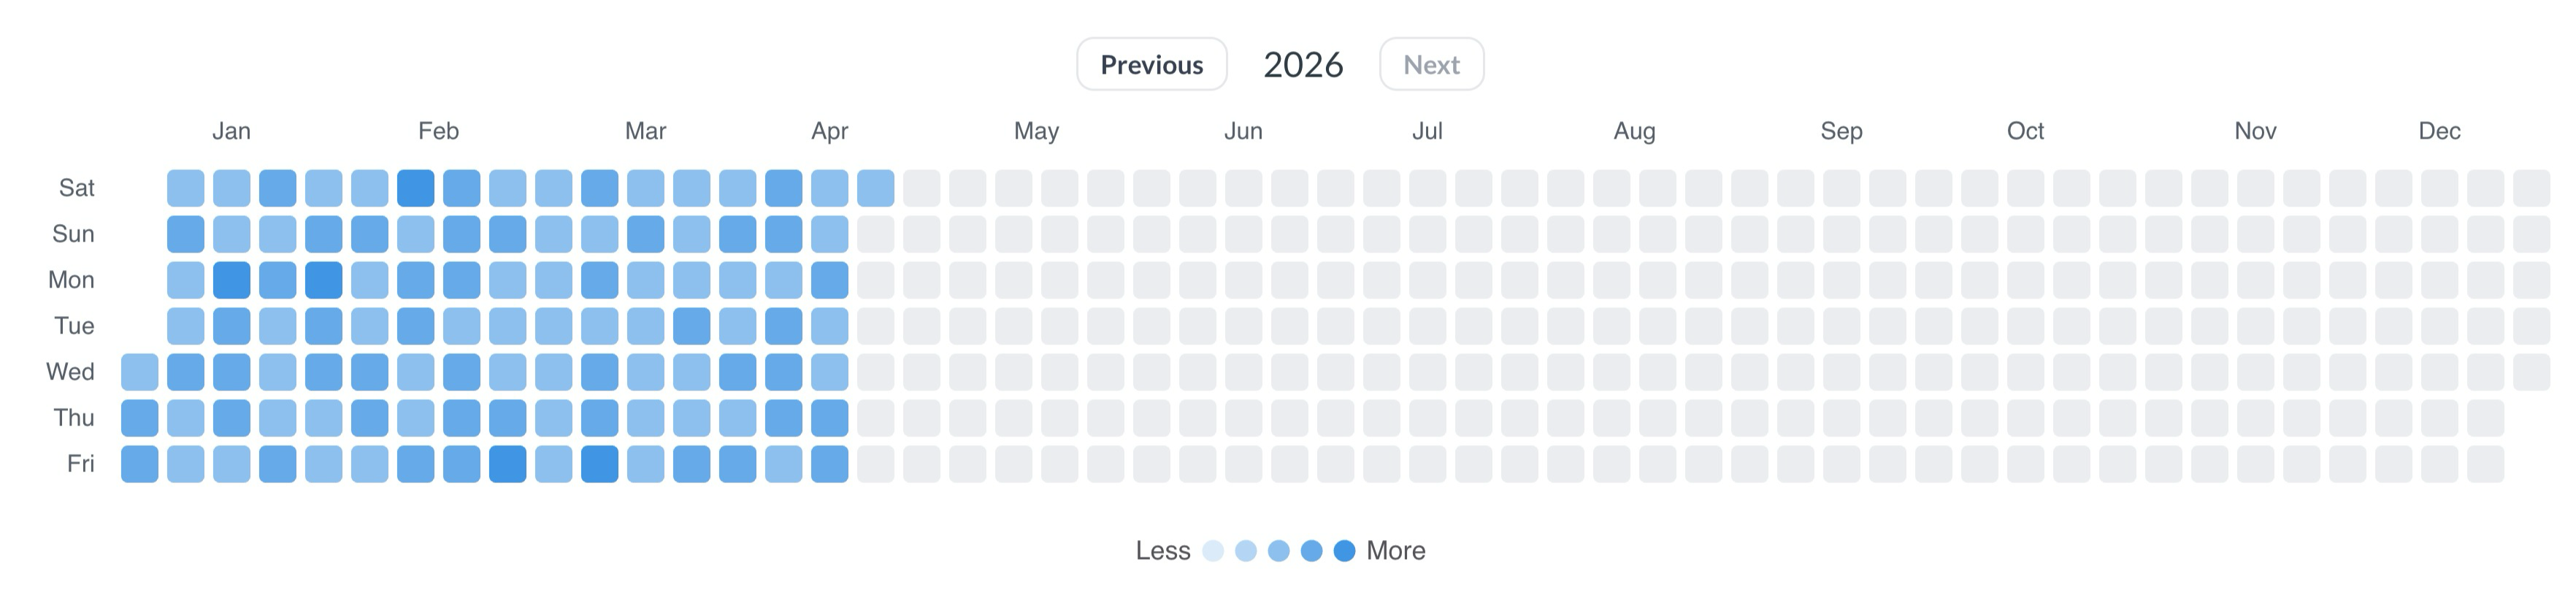
About
A Calendar Heatmap custom visualization for Metabase. Renders a GitHub-style year calendar where each cell represents a day, colored by an aggregated metric value.
Tags
#ddd
How to install
- 1
Download the plugin
Click "Download v1.0.2" above to get the .tgz archive.
- 2
Open Metabase admin settings
Go to Admin settings → Visualizations, then click "Upload plugin" and select the .tgz file.
- 3
Use it in your questions
The new visualization type will appear in the chart picker when editing any question.